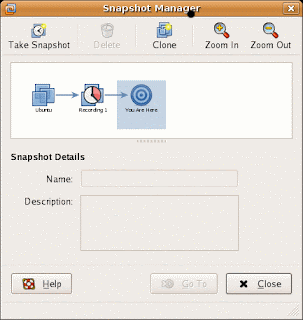
You can debug Linux processes running in the Virtual Machine as well. The approach is similar. First, you need to set up a replayable Virtual Machine. The easiest way is to convert existing Virtual Appliance. Here is how to do it in four steps:
Download VMware Workstation 6.0.1. Free evaluation version is here. The speed of recording and replaying is improved considerably in this release, especially with Intel Core 2 CPUs. Also, a few bugs here and there were taken care of.
Download Ubuntu 7.04 Virtual Appliance. (If you use different distro, check out this).
Unzip the appliance and edit the Ubuntu-7.04-desktop-i386.vmx. Add the following lines (they enable record/replay, add toolbar buttons to control the recording and enable remote debugging):
replay.logging = "TRUE"
pref.view.toolbars.vplay = "TRUE"
pref.view.toolbars.view = "FALSE"
debugStub.listen.guest32 = "TRUE"
debugStub.listen.guest32.remote = "TRUE"
pref.view.toolbars.vplay = "TRUE"
pref.view.toolbars.view = "FALSE"
debugStub.listen.guest32 = "TRUE"
debugStub.listen.guest32.remote = "TRUE"
Delete these lines (LSILogic and CD-ROM are not supported with Replay):
scsi0.virtualDev = "lsilogic"
ide1:0.startConnected = "TRUE"
... and add this line:
ide1:0.startConnected = "FALSE"
Power on the VM. It will ask you if you copied the VM - tell that you did. It will ask if you want to convert the SCSI to BusLogic type, click "yes".
Congratulations! You virtual machine is ready. For extra convenience, you may want to start /usr/bin/vmware-toolbox in a VM. This will automatically grab and release mouse when you enter or leave the VM.
The process of debugging is iterative. First you copy your application and tests inside the virtual machine, then you run the test scenario in recording mode until you get a crash. Once you've got a crash recorded, you can replay it as many times as you want, and inspect your application with debugger running on the Host. Let me go through these steps in details.
Copying the application and tests is easy. The appliance has networking enabled, so use you favorite network protocol: scp, ftp, rsync, etc. You need to make sure that you have same copy of the application running in the VM, and being passed to the debugger on the Host.
The VM has three new buttons on the Toolbar now: Record, Replay and Stop.

You can press Record, start the test inside the virtual machine and when it is done you can press Stop. This will record the execution of the test.

If you run gdb on the same Host, this line will attach gdb to the VM:
(gdb) target remote localhost:8832
By default our debugger is in system mode, that is, it doesn't know anything about processes in the virtual machine. To switch to process mode, you need to tell the debugger a little about the offsets of different kernel data structures. Here is how you can do it for Ubuntu 7.04:
(gdb) monitor linuxoffsets 0x20614,0x80,0,0x68,0x194,0xa4,0x1b0,\

(gdb) thread 22
Once attached, you can inspect memory, insert breakpoints, step over instructions, etc. When you are done, you can either issue "quit" in the debugger to shut down Virtual Machine and debugger, or issue "detach" to let the Virtual Machine continue running without debugger. Of course, you can attach the debugger again anytime.
It is convenient to combine all gdb steps into a macro, e.g.:
--- cut here: attach.gdb ---
Then you can attach gdb and get a list of processes with a single line:
% gdb --command=attach.gdb MyApp
The Replay feature remains experimental in the VMware Workstation 6.0.1. If you have a question or suggestion, or if you discovered a bug, please post here.
This note explained how to use replay debugging with processes running inside Ubuntu 7.04 Virtual Appliance. I will describe how to use it with different Linux kernels next.
5 comments:
Hi Salva,
Very interesting entry, thanks.
However, please may you explain how did you get the below numbers for the "monitor command" ?
0x20614,0x80,0,0x68,0x194,0xa4,0x1b0,\
0x24,0x18,0x28,0x2000,0xc4,0xec,0x10
This confused me, as I tried to follow your steps.
Best,
H
Hi Hieu,
The list of hex numbers gives gdb offsets of different fields in kernel data structures. If you do "monitor help linuxoffsets" it will tell you what these numbers are.
I plan to post another article shortly with script computing the numbers for any given Linux kernel.
Sincerely,
-slava
Salva, thanks so much for the help.
I am out of reach of VMWare now, so please could you post the result of "monitor help linuxoffset" here?
Best,
H
Hi Hieu. I just posted a new article that has the format of the "monitor linuxoffsets" string as well as a few scripts that compute offsets line automatically. Please post on the forum if you have a question or suggestion about it. Thank you!
I had to disable additional comments due to spam added to some other posts. Please post your comments and suggestions at our forum:
http://communities.vmware.com/community/vmtn/general/guestdebugmonitor
Thank you.
Post a Comment